
Why Oil Pattern Charts Confuse So Many Bowlers
Most bowlers have seen an oil pattern chart at some point — posted on the wall at a tournament, shared in a group chat, or pulled up online before league night. The problem isn’t access. It’s interpretation.
Oil pattern charts are packed with numbers, graphs, tables, and terms like ratio, forward oil, and reverse oil. The problem is, there is very little explanation of what any of it actually means for your ball motion. So bowlers either ignore the sheet completely… or try to understand everything on it and end up more confused than when they started.
A common misconception is:
“If I can understand every number on the pattern sheet, I’ll bowl better.”
In reality, that’s not how it works.
You don’t need to understand every detail of an oil pattern chart, oil pattern sheet, or lane oil chart to make good decisions on the lanes. Most of the information exists for lane machines and pattern designers — not for players standing on the approach.
What you do need is context. A few key pieces of information tell you far more than the rest of the sheet combined.
The goal of this article isn’t to turn you into a lane technician. It’s to show you how to quickly read a bowling oil pattern chart, identify what actually matters, and ignore what doesn’t — so you can spend less time guessing and more time executing shots with confidence.
What an Oil Pattern Chart Is Actually Telling You
Despite how complicated an oil pattern chart looks, it’s really answering just four core questions. Everything else on the pattern sheet supports one of these ideas.
If you can answer these three, you’re already ahead of most bowlers.
1. How far does the oil go?
The length tells you where the ball is allowed to hook. Pattern distance sets the boundaries for breakpoint and overall lane shape. A longer pattern pushes hook farther downlane, while a shorter pattern forces the ball to slow down sooner. This is the number that helps determine where you should be looking to exit the oil — not the exact line you must play, but the general area where motion can happen.
2. How much oil is on the lane?
Total oil volume affects how the ball reads the lane. Higher volume usually requires stronger equipment or more surface to create traction, while lower volume allows weaker balls to slow down and change direction more easily. This is less about hook and more about control — how early the ball picks up, how stable it feels, and how predictable misses will be.
3. How Forgiving Is the Pattern?
This is where ratios and pattern shape come into play. Some oil patterns are designed to provide built-in forgiveness, while others are meant to expose small mistakes. A more forgiving pattern blends wet and dry areas together, allowing minor misses to stay in play, while a flatter pattern demands much greater precision.
This part of the oil pattern chart helps explain why two patterns of the same length can play completely differently. It also highlights which zones of the lane are more forgiving than others — if you have the equipment, speed control, and accuracy to play in those areas. Keep in mind that a higher ratio doesn’t automatically make a zone playable for every bowler, but it does indicate where mistakes are punished less when your skillset and ball motion match the pattern. Typically, the higher the number (ratio) the easier the pattern will be and the higher the scoring.
4. How Fast Will I have to Deal with Lane Transition?
This is where forward oil and reverse oil come into play. When a pattern has a higher percentage of forward oil than reverse oil, the lane will transition faster. That usually means moving your feet sooner and potentially making ball changes earlier as the oil is removed more quickly.
Once you understand these four questions, the chart stops feeling overwhelming. You’re no longer trying to decode every number on the oil pattern sheet — you’re just looking for information that helps you make smarter decisions.
With that foundation in place, we can now look at a real oil pattern chart and break it down piece by piece.
An Example Oil Pattern Chart (USBC Open Championships)
To make all of this easier to understand, let’s look at a real example.
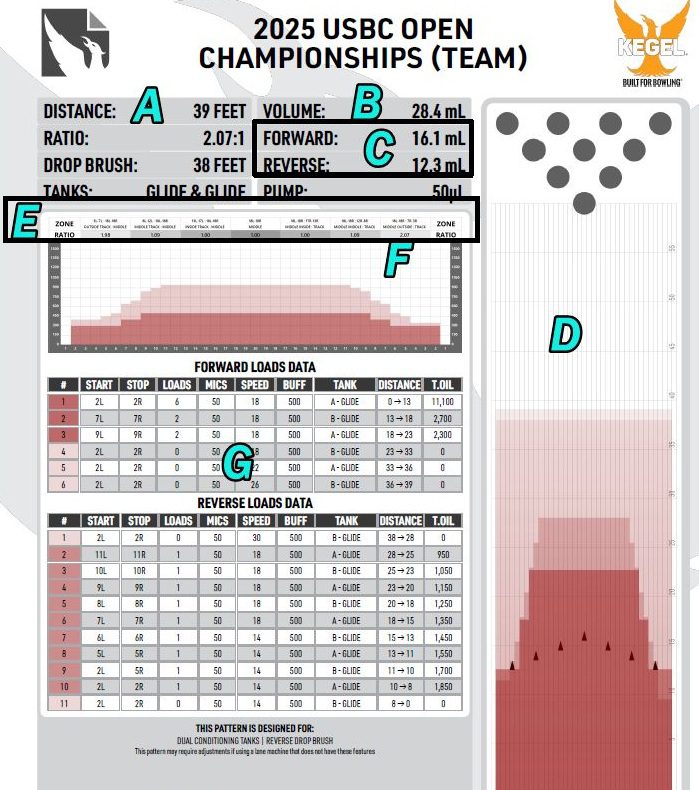
Below is the oil pattern chart used for the USBC Open Championships Team Event. This is a great pattern to learn from because it’s clearly defined, heavily documented, and intentionally challenging — which makes the information on the chart matter more.
On the image below, key areas of the oil pattern chart are labeled to highlight what each section actually tells you as a bowler. These labels don’t represent every number on the sheet — they focus on the parts that influence ball motion, lineup decisions, and how the pattern will play.
As you go through the breakdown that follows, you’ll see how each labeled section connects back to the three core questions we just covered:
- how far the oil goes
- how much oil is on the lane
- how forgiving the pattern is side-to-side
You don’t need to memorize the chart. You just need to know where to look — and what to ignore.
Breaking Down the Chart (Letter by Letter)
Now let’s walk through the oil pattern chart one piece at a time. Each section below corresponds to a labeled part of the chart, focusing only on what actually helps you make decisions on the lanes.
We’ll start with the two numbers that influence almost every lineup and ball choice decision you make.
A. Oil Pattern Distance
The chart shows this distance as 39 feet.
Oil pattern distance tells you how far downlane oil is applied. This matters because a bowling ball cannot begin to change direction consistently until it reaches friction. When oil extends farther down the lane, the friction point moves farther away. When oil ends sooner, the ball slows down earlier.
A common guideline bowlers use is the Rule of 31:
Oil pattern distance minus 31 gives you a starting point for where the ball can begin to exit the oil.
In this case:
- 39 feet − 31 = 8 board
That doesn’t mean you must play the 8 board, and it doesn’t dictate your exact line. What it does is give you a reference point for where the ball can realistically start to transition. Think of it as defining the window where ball motion becomes possible, not a rigid rule you have to follow.
Ultimately, pattern distance controls where the lane will allow motion to happen. Everything else on the chart works around that constraint.
B. Total Oil Volume
Next is total oil volume, listed in milliliters (mL). In this example, the pattern uses 28.4 mL, which is considered high volume.
Total volume represents how much oil is on the lane overall — not where it’s placed, but how much exists to be moved, absorbed, and broken down.
As a general reference:
- 22 mL or less → low volume
- 22–26 mL → medium volume
- 26 mL and higher → high volume
Higher oil volume doesn’t automatically mean the pattern is harder, but it does change what your equipment needs to do. With more oil on the lane, the ball has to work harder to slow down and create traction. That usually means starting with:
- stronger bowling balls
- more surface
- a roll that is more forward and controlled
This is why high-volume patterns often look like they “don’t hook” early — not because motion is impossible, but because the lane requires the ball to use more energy just to read the oil.
Understanding volume helps set expectations. It tells you how aggressive your equipment needs to be before you ever worry about exact lines or adjustments.
C. Forward Oil vs Reverse Oil
Oil patterns aren’t applied all at once — they’re layered as the lane machine moves forward and then backward. That’s where forward oil and reverse oil come from.
- Forward oil is applied as the machine moves toward the pins. This oil ends up closer to the end of the pattern and is removed more quickly by bowling balls.
- Reverse oil is applied as the machine moves back toward the foul line. This oil tends to stay on the lane longer and helps stabilize the pattern.
The relationship between forward and reverse oil gives you insight into lane transition.
When a pattern has a higher percentage of forward oil than reverse oil, the lane will typically break down faster. Oil is removed more quickly, and you’ll often need to move your feet and make equipment adjustments earlier. Patterns with a higher percentage of reverse oil tend to hold up longer, allowing you to stay in the same part of the lane for more frames before adjustments are required.
This forward/reverse balance doesn’t tell you where to play — it tells you how patient you’ll need to be and how quickly the pattern is likely to change over time.
D. Pattern Shape (Top-Down Image)
On the right side of the oil pattern chart is a top-down image of the lane. This graphic shows how oil is distributed side-to-side from the foul line to the end of the pattern.
This image highlights two key characteristics:
- Width — how far left and right the oil is applied
- Taper — how gradually the oil blends from one zone to another
Wider patterns with more taper tend to play smoother and more predictably, while narrower patterns with sharper edges punish misses more quickly. This is less about how much motion the ball creates and more about how consistently it reacts when you miss your target slightly.
Pattern shape is one of the main reasons two patterns with the same length and volume can feel completely different. The shape determines whether the lane blends mistakes together — or exposes them.
E. Track Zone Ratios
Track zone ratios compare how much oil exists between adjacent zones across the lane. Rather than showing where the ball will go, ratios indicate how forgiving different areas of the lane are when you miss your intended target.
A higher ratio means there is a larger difference in oil between two zones, which generally results in more forgiveness. A lower ratio means oil is distributed more evenly, leaving little margin for error.
This is where context matters. Even a 2:1 ratio is considered flat by most bowling standards. On typical house conditions, ratios are often much higher. So while a 2:1 zone may be less punishing than other parts of the lane, it still requires precision. This pattern is 2.0 which is very challenging. A typical house shot is usually around 10-11.
It’s also important to separate two ideas:
- Miss room — how much error a zone can tolerate
- Free shape — motion created without precise execution
Ratios describe miss room, not free motion. On this pattern, the ratios create control, not shape. Certain zones punish mistakes less than others, but none of them offer easy solutions. You still have to match your speed, launch angle, and equipment to the pattern for the ratio to matter.
F. 2L / 2R and Oiling Range
The 2L and 2R numbers indicate how far left and right the lane machine applies oil. In simple terms, they define the horizontal range of the pattern.
A narrower oiling range creates sharper edges between oil and friction. That leads to:
- steeper cliffs
- less built-in bailout
- more sensitivity to small misses
Wider oiling ranges tend to blend those transitions and feel smoother.
For most bowlers, this number is informational, not actionable. It helps explain why a pattern feels touchy or demanding, but it doesn’t usually change where you line up or what ball you choose. That’s why many bowlers overthink this number — it describes the lane’s structure, not a strategy you need to chase.
G. Forward & Reverse Load Tables (What You Can Ignore)
At the bottom of most oil pattern charts are forward and reverse load tables. These tables show how much oil is applied on each board as the lane machine moves forward and backward.
This information is critical for:
- lane machines
- pattern designers
- lane maintenance staff
For bowlers, it’s largely unnecessary.
These tables exist to document how the pattern was applied, not how it will play for you. They don’t provide clear guidance for ball choice, alignment, or adjustments during competition.
You’re not missing anything by skipping them.
Understanding which parts of an oil pattern chart you can safely ignore is just as important as knowing what to focus on. It frees you from information overload and keeps your attention on decisions that actually affect your performance.
Putting It Together: How This Actually Plays
This is where all the chart data turns into real decisions on the lane. A good example here is the USBC Open–style pattern, because it forces you to respect what the numbers are actually telling you instead of what you want them to say.
Exit point: around 7–8
When you combine a shorter distance, low ratio, and a tight track zone, the pattern basically funnels you toward a defined breakpoint. Around 7–8 isn’t magic—it’s just where the oil pattern stops protecting the ball. Miss right of that and there’s no free hook coming back. Miss left and the ball never sees friction soon enough.
That’s the pattern doing its job.
Straighter angles win
This is not a “cover boards and trust the friction” pattern. The low ratio and tighter oiling range mean you’re rewarded for keeping angles in front of you. Straighter lines reduce the penalty for small misses and help your ball read the lane in the same place, shot after shot.
You don’t need to be perfectly straight—but you do need to keep the ball from crossing too many zones too fast.
Strong balls for control, not backend
This is the part a lot of bowlers get backwards.
Yes, stronger balls are often the right choice here—but not to create shape.
Use strong balls to:
- Read the midlane sooner
- Blend the end of the pattern
- Keep the ball from skidding past the breakpoint
Surface and core strength help you control where the ball slows down, not how hard it turns the corner.
Why opening the lane is a trap
The chart might look playable, but the ratios tell the truth. There isn’t enough built-in miss room to support big angles. Trying to open the lane usually leads to:
- Overreaction when it hits friction
- Flat hits when it doesn’t
- Constant guessing if the ball is early or late
The pattern isn’t asking you to be creative—it’s asking you to be disciplined.
The big takeaway
When you put the distance, volume, ratios, and shape together, the pattern clearly favors:
- Defined exit points
- Controlled ball motion
- Simpler moves as the lane transitions
This is what “sport control” actually looks like. The lane gives you just enough hook to strike—but only if you listen to what the data is saying instead of fighting it.
Common Mistakes Bowlers Make When Reading Pattern Sheets
This is where a lot of bowlers get themselves into trouble—not because they can’t read the sheet, but because they read it the wrong way.
Chasing ratios instead of controlling motion
Ratios are useful, but they’re not a game plan. A low ratio doesn’t mean “there’s no hook,” and a higher ratio doesn’t mean “swing it.” What matters more is whether your ball motion matches what the pattern can actually support. When bowlers chase ratios, they often abandon a controllable shape that’s working in favor of something that looks better on paper.
The goal isn’t to find hook—it’s to manage it.
Equating strong balls with hook
This one’s huge. Stronger balls don’t automatically mean more backend. In many cases, they do the opposite. On flatter patterns, strong balls are tools for:
- Earlier read
- Slower response to friction
- Tighter control downlane
When bowlers assume “strong = hook,” they often jump into shiny equipment too early and lose the midlane completely.
Moving too fast when reverse oil is high
High reverse oil slows transition. That means the lane usually holds up longer than bowlers expect. A common mistake is making aggressive moves after one bad shot—changing balls, jumping zones, or opening angles—when the pattern hasn’t actually changed yet.
With more reverse oil, patience is part of the strategy. Small moves beat big guesses.
Assuming “flat = impossible”
Flat patterns don’t remove scoring—they remove free scoring. There’s a big difference. These patterns reward:
- Accuracy
- Repeatability
- Smart miss management
When bowlers label a pattern as “impossible,” they stop making good decisions and start hoping. And hope is never part of a good lane-play plan.
Coaching takeaway
Pattern sheets aren’t meant to intimidate you—they’re meant to guide you. If you use them to control motion, stay patient with transition, and trust simpler shapes, even flatter patterns become playable. Not easy—but absolutely manageable.
The Oil Pattern Cheat Sheet (Save This)
Save this part and come back to before practice, league, or a tournament block. No overthinking. No spreadsheets. Just the information that actually helps you make decisions.
If you only look at four things, look at these:
Pattern Length → Where to Play
Longer patterns push you straighter and closer to the pocket. Shorter patterns allow you to move your breakpoint right and open angles if the shape supports it. Length controls where the ball is allowed to slow down. This is the Rule of 31.
Oil Volume → What Ball Strength to Use
Higher volume usually means you’ll need earlier read and more traction. Lower volume allows cleaner equipment and smoother layouts. This is about how soon the ball needs to slow down, not how much it needs to hook.
Forward vs Reverse Oil → How Fast the Lane Changes
More forward oil relative to reverse means the pattern will break down faster. More reverse oil means the lane tends to hold up longer. This tells you how aggressive—or patient—you need to be with moves. Take the reverse total oil and divide it by the total oil. If the number is higher than .5, it should breakdown about “average” to a house shot. If it’s .75, you probably won’t have to move much. And if it’s closer to .25, you’ll probably really have to move and keep changing your lines you’re playing and/or your equipment.
Track Ratio → How Much Miss Room You Have
Higher ratios indicate more forgiveness within that zone. Lower ratios demand tighter execution. A “more forgiving” zone is beneficial only if you have the equipment and skillset to play there—not because it creates free hook. The higher the number, the easier the shot is. 10 is considerably easier than a 2.
Optional: What You Can Ignore (Most of the Time)
Forward/reverse load tables, machine-specific numbers, and anything that doesn’t directly change where you play, what you throw, or how fast the lane transitions.
If a number doesn’t help you answer one of those three questions, it’s probably not worth stressing about.
Final Thought: Oil Patterns Don’t Tell You What to Throw — They Tell You What to Avoid
Oil pattern charts don’t give you answers. They give you boundaries.
The charts also show you where the lane is likely to support motion — and where it won’t. They tell you which parts of the lane are risky, which decisions are low percentage, and which mistakes get punished quickly. That’s it.
The goal isn’t to find the ball or the line.
The goal is control, repeatability, and staying out of trouble.
Understanding the chart doesn’t eliminate execution errors — but it dramatically reduces guessing. And when you guess less, you manage transition better, make calmer moves, and keep yourself in play longer.
That’s real scoring.
How This Compares to a Typical House Shot
Compared to the USBC Open pattern, a typical house shot usually features:
- Higher ratios → more forgiveness side-to-side
- Medium Oil Volume → wider range of balls to use
- More free hook → missed shots recover more often
- Higher reverse oil vs forward oil → the lanes don’t transition as fast
The same numbers are on the chart — they just tell a very different story.
In the next post, we’ll break down a typical house shot oil pattern and show how these same numbers lead to completely different decisions.